The Only Way to Know What Your Direct Mail Actually Moved
QR codes and call tracking under-attribute. Matchback can over-attribute. Holdout testing tells you which story you're living.
Your matchback report says the spring tune-up campaign drove $2.16M in revenue. Your CFO asks: "How much of that would have come in anyway?"
You don't have a good answer.
That's because matchback attribution tells you who received mail and later booked a job. It doesn't tell you whether the mail caused them to call. For contractors running maintenance reminders or win-back campaigns, this distinction is everything.
The Attribution Problem: Under and Over
Direct tracking under-attributes. QR codes and dedicated call tracking numbers only capture 20-35% of direct mail responses. The rest? Customers who saw your postcard, stuck it on the fridge, and called your main line three weeks later when the AC quit. If you only looked at tracked responses, you'd massively undercount your campaign's reach.
Matchback over-attributes. Matchback fixes the under-counting problem by matching your ServiceTitan data back to your mail file. Now you can see everyone who received mail and later booked a job, not just the ones who used the QR code.
But here's the catch: matchback can't distinguish between customers who called because of the mail versus customers who would have called anyway. Your maintenance agreement customers were probably going to book their spring tune-up regardless. Your matchback report credits the mailer for revenue that was coming no matter what.
So while direct tracking under-counts, matchback over-counts. Neither tells you the true story.
The Holdout Test: Finding the Truth
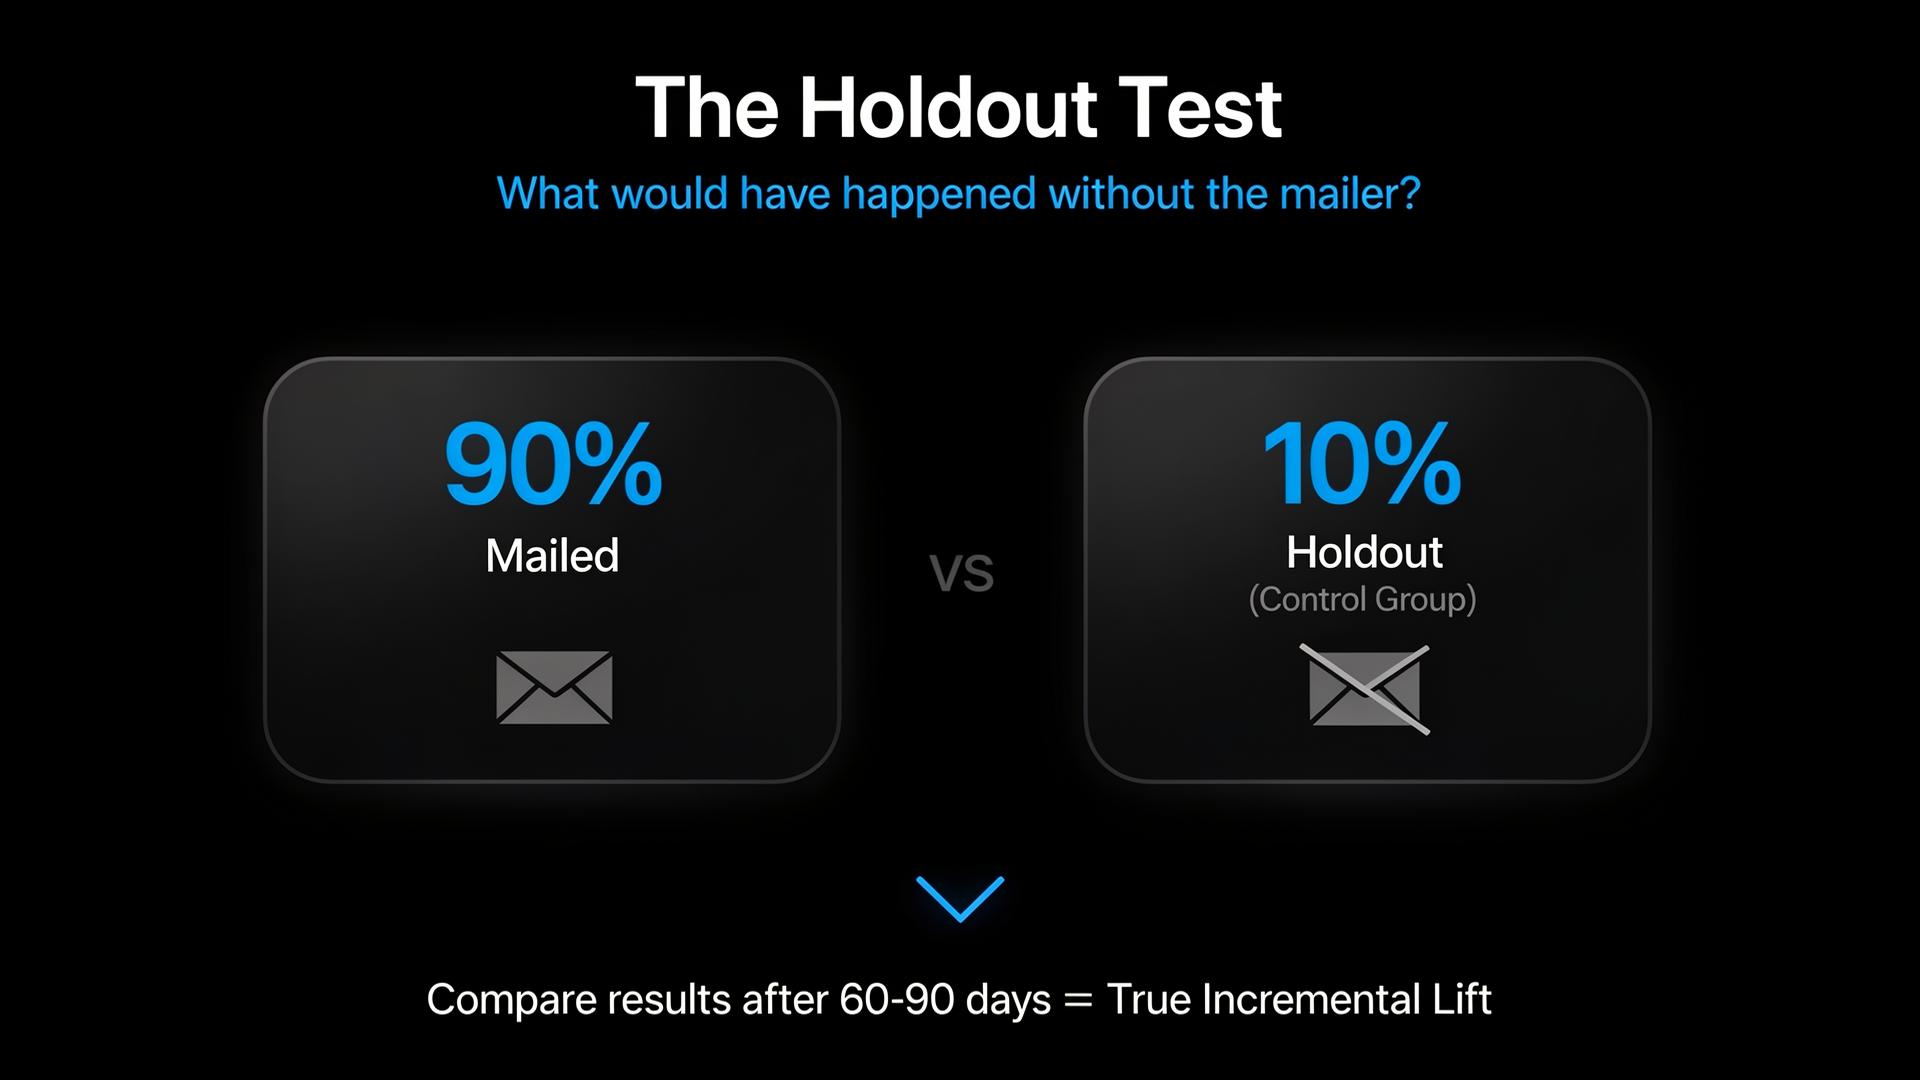
A holdout group is a small slice of your audience (5-10%) that you intentionally don't mail. They're your control group. They tell you what would have happened without the mailer.
After 60-90 days, compare revenue between the two groups. Here's what that looks like for an HVAC platform running a win-back campaign to 100,000 lapsed customers:
| Metric | Mailed Group | Holdout Group |
|---|---|---|
| Customers | 90,000 | 10,000 |
| Jobs Booked | 675 | 20 |
| Total Revenue | $6,210,000 | $30,000 |
| Avg Ticket | $9,200 | $1,500 |
The holdout group generated just $3.00 per customer without any mailer. That's your baseline: minimal organic demand from this lapsed segment.
Here's where the three attribution methods diverge:
| Method | What It Shows | Revenue Attributed |
|---|---|---|
| Direct tracking (QR + call) | Only tracked responses | ~$1,900,000 (under-counts) |
| Matchback | Everyone who got mail and booked | $6,210,000 (needs validation) |
| Holdout-adjusted | True incremental lift | $5,940,000 (the real answer) |
Your true incremental lift: $66.00 per customer × 90,000 = $5,940,000.
In this case, the holdout validates that the campaign drove almost all of the revenue. Only $270,000 (extrapolated baseline) would have come in anyway. The matchback was directionally accurate, not inflated.
A note on sample size: A 10,000-person holdout gives you strong directional insight, and statistical confidence improves with larger lists or by aggregating results across multiple campaign cycles.
Why This Matters for Home Services Platforms
The holdout can tell two very different stories depending on your audience.
Win-back and conquest campaigns often show dramatic lift like the example above. Lapsed customers weren't going to call on their own. The campaign actually moved them. Matchback gets validated.
Maintenance reminders to active customers often tell the opposite story. These customers were probably going to book their spring tune-up regardless. Matchback over-attributes because it can't separate caused from coincidental.
Without a holdout, you don't know which story you're living. You might be under-investing in campaigns that actually work, or over-spending on customers who don't need the nudge.
What You'll Learn
The real power comes from comparing holdout performance by segment:
| Segment | Mailed Response | Holdout Response | True Lift |
|---|---|---|---|
| Active maintenance agreement | 12% | 11% | ~9% (low) |
| Last service 1-2 years ago | 4% | 0.5% | ~8x (high) |
| Lapsed 3+ years | 0.8% | 0.2% | ~4x (moderate) |
This tells you where your marketing dollars actually work:
Maintenance agreement customers are already loyal. Matchback shows 12% response, but holdout reveals they were going to call anyway. Reduce frequency or skip them entirely.
1-2 year inactive customers show dramatic incremental lift. The mailer actually moved them. Double down here with stronger offers or earlier timing.
Lapsed 3+ years respond poorly in absolute terms, but the mailer still drives meaningful lift over baseline. Test smaller batches before scaling.
Making It Operational
The best approach uses all three layers: direct tracking captures immediate response, matchback recovers the full picture, and holdout testing reveals true incremental lift. But running holdout tests requires discipline: clean data, consistent execution, and tracking who was held out and why.
Most platforms don't have the bandwidth to manage this manually alongside day-to-day operations.
Purpose-built software can automate the heavy lifting. At Arch, holdout measurement is built into every campaign. Contractors see true incremental revenue alongside matchback results, not instead of them, and the system continuously learns which segments need the nudge and which don't.
Want to see your true incremental lift? Arch combines matchback attribution with automatic holdout testing on every campaign, so you get the full picture: what your marketing reached and what it actually moved.
Sources:
Direct Mail Attribution – Franklin Madison
5 Direct Mail Attribution Strategies – Sharpdots
Measured – Incrementality Research