The Retention Gap: Q4 2025 Churn Benchmarks for Home Services
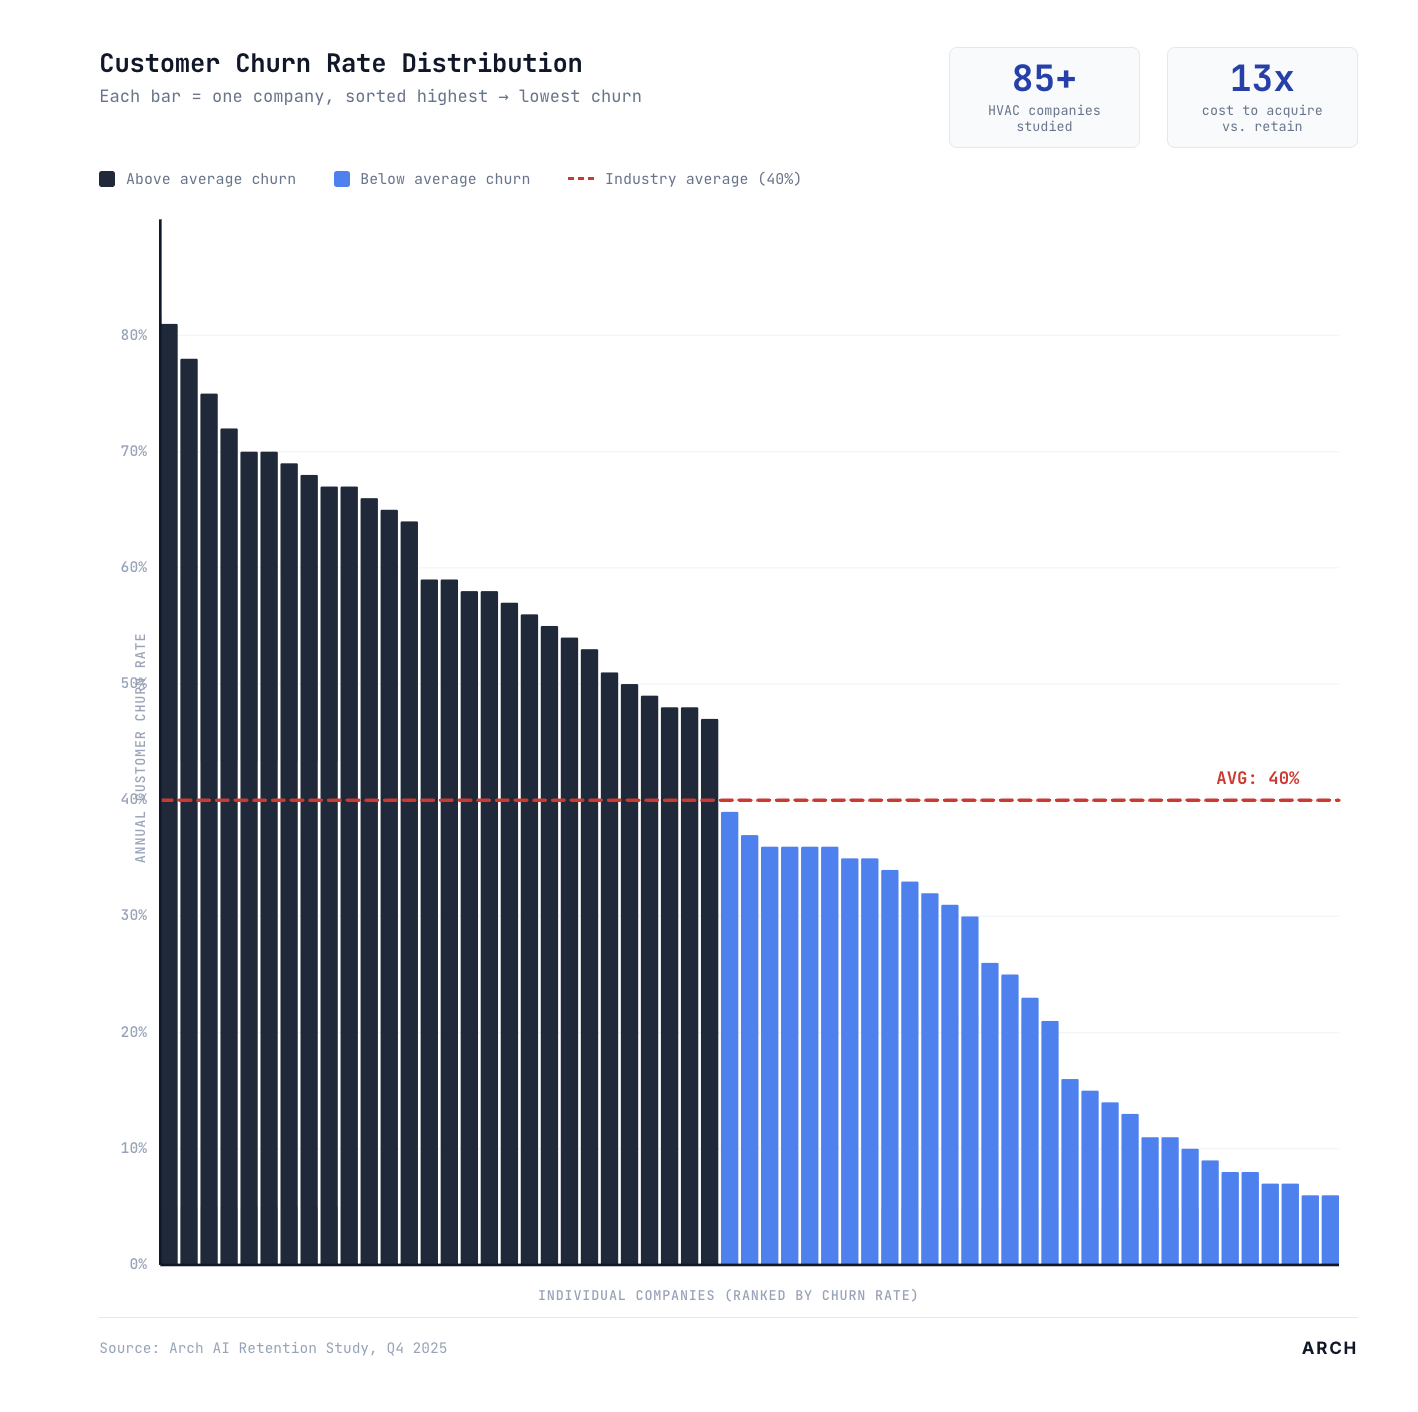
We measured annual customer churn rates across 85+ home services companies. The results reveal a massive gap between best-in-class operators and the industry average.
We measured annual customer churn rates across 85+ home services companies nationwide. The goal: establish the first industry-wide benchmark so operators can see where they actually stand.
The results were striking.
By the numbers
- Best-in-class: 7% annual churn
- Industry average: 40%
- Worst performers: 81%
- Cost gap: Acquiring a new customer costs roughly 13x more than keeping an existing one
Why it matters
The average contractor is replacing nearly half of their customer base every single year. That's not growth. That's a treadmill.
About half of the companies in our study fall above the 40% average line. These operators are spending aggressively on new customer acquisition while their existing customers quietly walk out the back door.
The other half figured out something important.
What the top performers do differently
It's not a secret. It's a sequence.
Step 1: Diagnose retention gaps. Know which customers are at risk, why they're leaving, and how much revenue is walking out the door.
Step 2: Act on it. Proactive outreach, targeted reactivation, service reminders timed to when customers are most likely to churn.
Step 3: Only then, invest heavily in new customer acquisition.
This order matters because customer acquisition costs across the trades are rising fast. Pouring marketing dollars into a leaky bucket doesn't scale.
A retained customer base compounds. They buy more services over time, refer their neighbors, and cost a fraction to maintain.
The math, simplified
Two companies. Same starting point. Very different outcomes.
| Company A | Company B | |
|---|---|---|
| Customers | 10,000 | 10,000 |
| Annual churn | 40% | 15% |
| Customers lost per year | 4,000 | 1,500 |
| Customers to replace | 4,000 | 1,500 |
| Relative acquisition cost | $$$$ | $$ |
Now multiply that gap over three years.
Company B isn't just saving on acquisition. It's building a fundamentally more valuable business, because retained customers keep buying, keep referring, and keep compounding.
The bottom line
Most home services operators don't measure churn at all. They track new leads, new bookings, and revenue. But they rarely ask the most important question: how many of last year's customers came back this year?
That single number is the starting point.
If churn is high: stop the bleeding before investing another dollar in growth.
If churn is low: that's your signal to expand aggressively, because the foundation is solid.
Either way, the first step is knowing where you stand.
Want to see how your operation compares? We offer a complimentary benchmarking analysis for home services platforms and large independents.
Request your benchmark →