The Heat Wave Cycle
Heat wave demand builds across the whole streak, not off a single hot day, and it can return as a second spell. What HVAC call data shows about timing campaigns.
Heat wave demand builds across the whole streak, not off a single hot day's reading, and it can come right back as a second spell.
The question isn't whether a heat wave drives HVAC calls. It's when, and for how long. We analyzed call data from a multi-trade contractor in the Mid-Atlantic against the region's actual weather history to find out.
Spend before the streak starts, not while it's peaking
Plan your campaigns around time and temperature.
ServiceTitan reported that the first sustained heat wave of a season drives a 55-90% jump in HVAC revenue. Our analysis found the same pattern, and dug a level deeper into why.
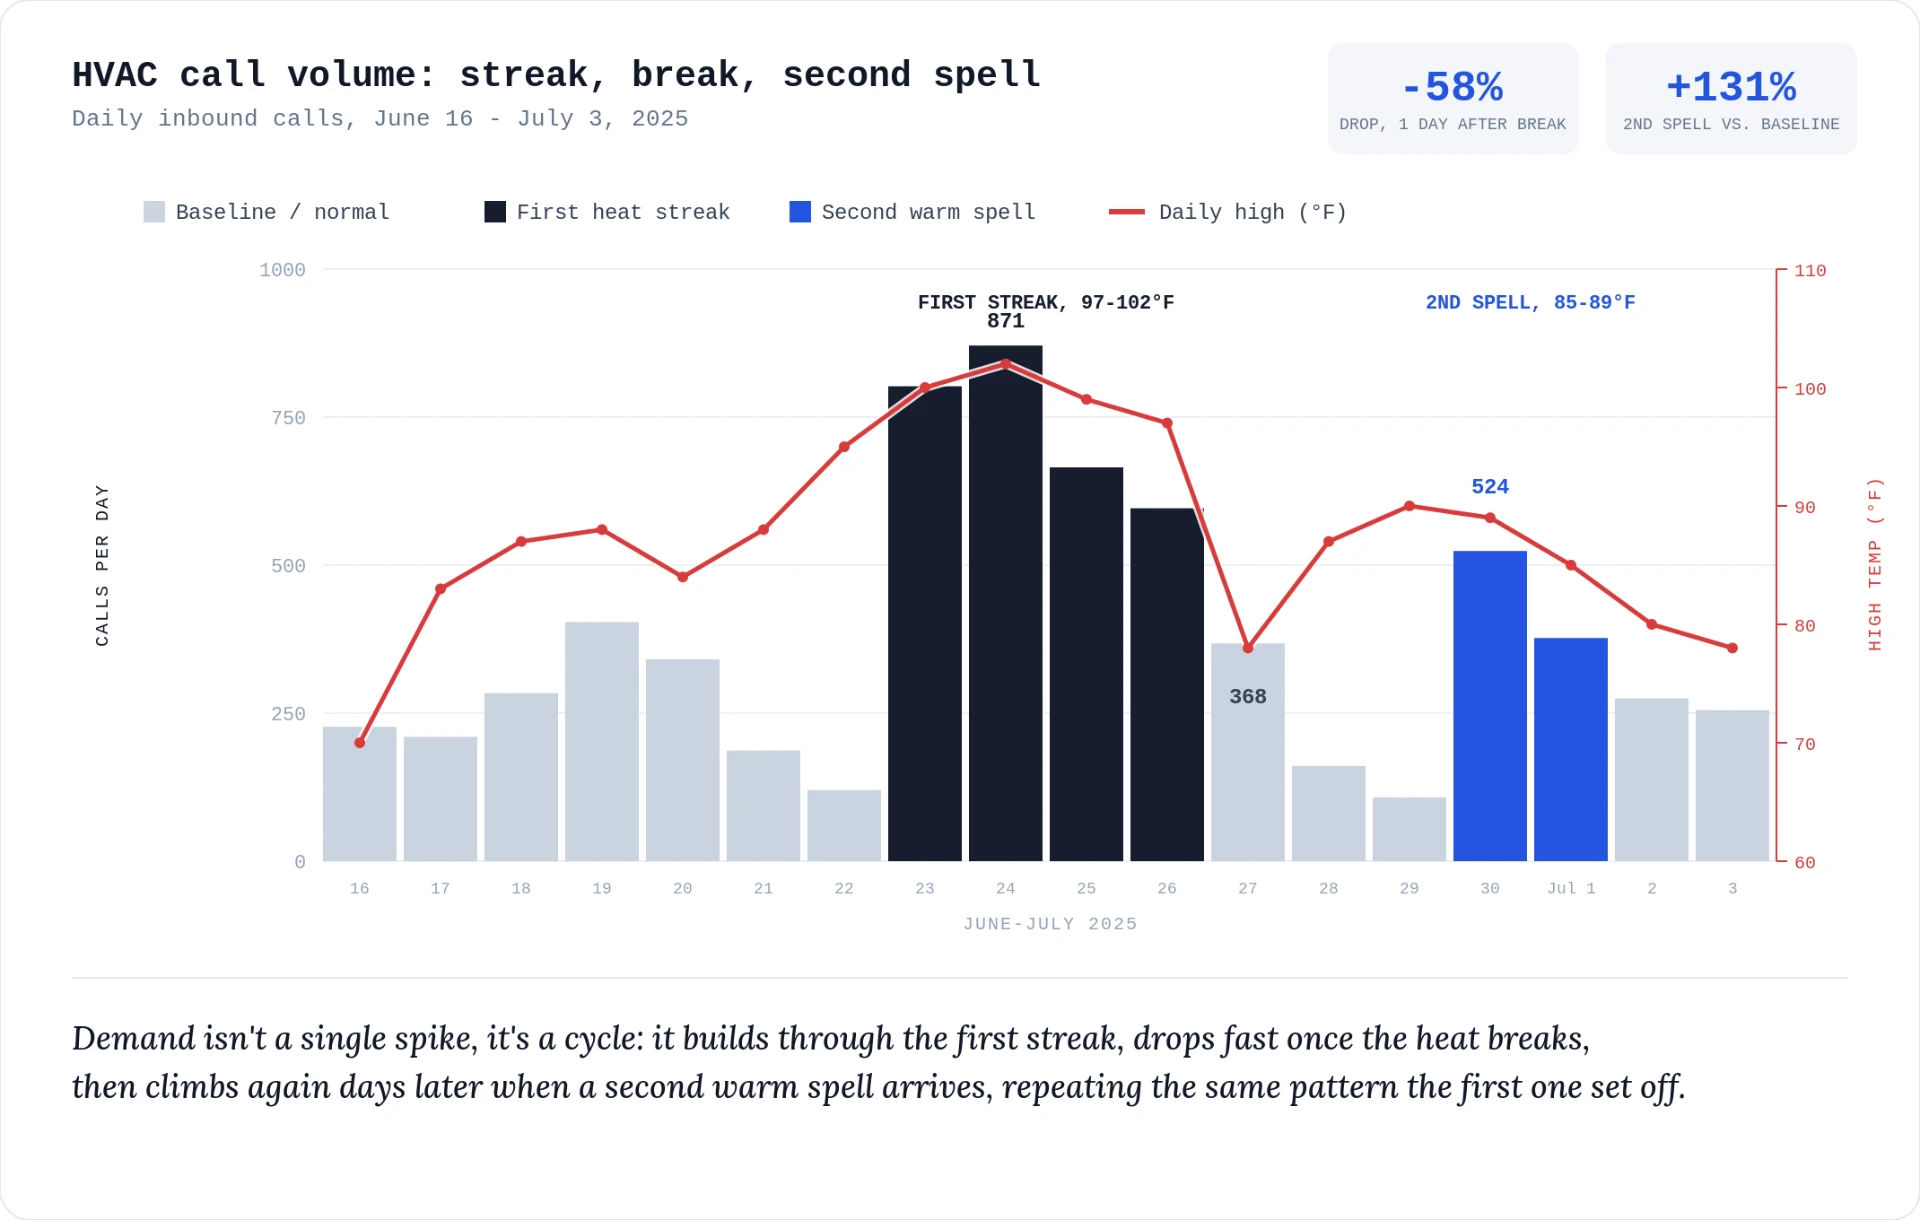
During the region's first heat streak of summer 2025 (June 23-26, highs of 97-102°F), HVAC call volume roughly tripled the pre-streak weekday average and held there for all four days, peaking at 871 calls on day two before easing as the streak continued.
Two separate dynamics explain it.
- Duration beats intensity. HVAC components lose efficiency when they never cool down between cycles, so failure risk builds with each consecutive hot day, not with peak temperature. That's why volume held elevated for all four days instead of spiking once and fading.
- The buyer pool shrinks all season. Replacement isn't an impulse buy. Homeowners spend a few weeks comparing quotes, so a heat wave early in the season hits a full pool of undecided homeowners, while the same wave in August is pulling from a pool already thinned by earlier events and competitors.
HVAC is already one of the highest cost-per-click categories in home services, and per Google Ads benchmarks, costs climb further once a heat wave hits and every competitor bids on the same keywords. First-of-season beats any later event, and campaigns need to already be live when it hits.
Budget for the second spell, not just the first
Temperatures fell to 78°F on June 27. Call volume fell with it: down 58% in a day, from 871 calls at the peak to 368, already close to a normal weekday. By the weekend it was back to baseline.
Two days later, a second warm spell pushed highs back to 89-90°F. Monday's calls jumped to 524, 131% above a typical Monday, before easing over the next two days.
The break isn't the end of the season. A campaign paused the day the streak ends can miss a second one days later that still moves real volume. Trend tracking catches both. A calendar reset at the first cool day catches neither.
The Playbook
- Spend before the heat wave, not during it. Fund campaigns ahead of the season's first major event, while the buyer pool is still full and before every competitor bids the keyword up.
- Trigger on trends, not thresholds. A single-day "if hot, show ad" rule can't tell a real heat wave from routine weather, and it can't tell you a second event is starting either. Consecutive days above a mark and year-over-year deviation can.
Where Arch Fits
Ask Arch's weather tool is a trigger-based outreach system that tracks weather across the zip codes a company actually dispatches to. When a real streak shows up, outreach is already staged to fire before call volume increases.
In August, it flagged what looked like a bug: a call-volume forecast dropping sharply on the last day of its window. It wasn't a bug. A cold front was expected soon, which would reduce demand later. However, early sales efforts using weather data had already covered most of the expected demand.
It runs on two modes: a precise, day-by-day forecast for the next two weeks, and a longer-range system that extends out several months by trading daily precision for a broader trend.
That range is what separates a real signal from a routine hot day. The tool compares degree-days to the same period last year, and flags a streak once temperatures hold above or below a threshold for several days straight. It catches the streak before the calls do, including the second one.
Bottom Line
Heat waves don't hit once, they come in waves. Build a marketing system that runs on autopilot, catching each one on the forecast, because the first wave pulls the most demand and every one after pulls less.
FAQ
What is the "heat wave cycle" in HVAC demand?
The repeating pattern behind heat-driven demand: calls build through a streak, drop fast once it breaks, then climb again if a second warm spell follows.
How much does HVAC call volume increase during a heat wave?
Roughly triples. Our analysis peaked at 871 calls a day; industry-wide, first heat waves drive a 55-90% jump in HVAC revenue.
Why does demand drop when the heat wave breaks?
Failure risk built up over the streak resolves fast once the load lifts. Calls fell 58% within a day of the break, back to baseline by the weekend.
Can demand come back after it drops?
Yes. A second warm spell two days later pushed calls up 131% versus a typical weekday, smaller than the first wave's peak but still enough to catch an unprepared campaign off guard.
How do I know when to launch a heat wave campaign?
Track consecutive hot days, not a single threshold. Arch's weather tool flags a real streak, first or second, before call volume increases.